
Genre: US Intelligence Maps
- Title
- en Genre: US Intelligence Maps
- Description
- en A collection of maps created by the Office of Strategic Services (OSS; now CIA) during and shortly after World War II.
- Creator
- en Office of Strategic Services
- Date
- 1942
- 1946
- Language
- en en
- Contributor
- eng Sarah Calhoun
Items
-
 EXAMPLE: Japan Ports of Greatest Shipping Activity 1934This colored map was produced by the OSS Research and Analysis Branch on September 1, 1945, and measures 42 × 31 cm. It vividly depicts Japan’s four main islands with carefully rendered geographic outlines, overlaid with circular pie charts that indicate shipping capacity at various ports. The map summarizes Japan’s 1934 port capacity by focusing on the gross shipping tonnage handled at key ports. It emphasizes a dramatic concentration of shipping activity along the western half of the Inland Sea, highlighting ports such as Moji, Kobe, Osaka, Shimonoseki, and Yokohama. Notably, the map omits any reference to Japan’s colonial empire—a significant exclusion considering the era’s aggressive imperial expansion and growing militarism. The pie charts, based on the British Moorsom system, offer insights into the maritime capabilities of these ports, reflecting the robustness of Japan’s shipping industry. Produced as Japan was transitioning from imperial ambitions to occupation, the map represents an critical moment in maritime history and remains a valuable document for understanding both Japan’s domestic infrastructure and its broader geopolitical context.
 -
 Far East Japanese Occupied Area Major RailroadsThis color printed map displays shaded areas in East Asia and Southeast Asia to indicate the extent of Japanese control in 1943. The map focuses on the major railroads in this region; a legend in the top-left corner categorizes these railroads as operational, dismantled, or under construction. Areas under Japanese control generally have a much higher density of railroads than those outside of these regions. While certain railroads go beyond Japanese-occupied areas, these railroads typically become dismantled as they cross the border. The focus on railroads is likely to help gain a better understanding of Japan’s supply routes and logistics. The map also shows international and provincial political boundaries, rivers, and cities along the railroad routes. With a few exceptions in southern China, in areas not under Japanese control, only rivers and political boundaries are shown. We especially note that this map is initially drawn by the Research & Analysis Branch of OSS and reproduced by OSS. The map is a provisional edition from March 12, 1943, but uses data from March 2nd, 1943.
 -
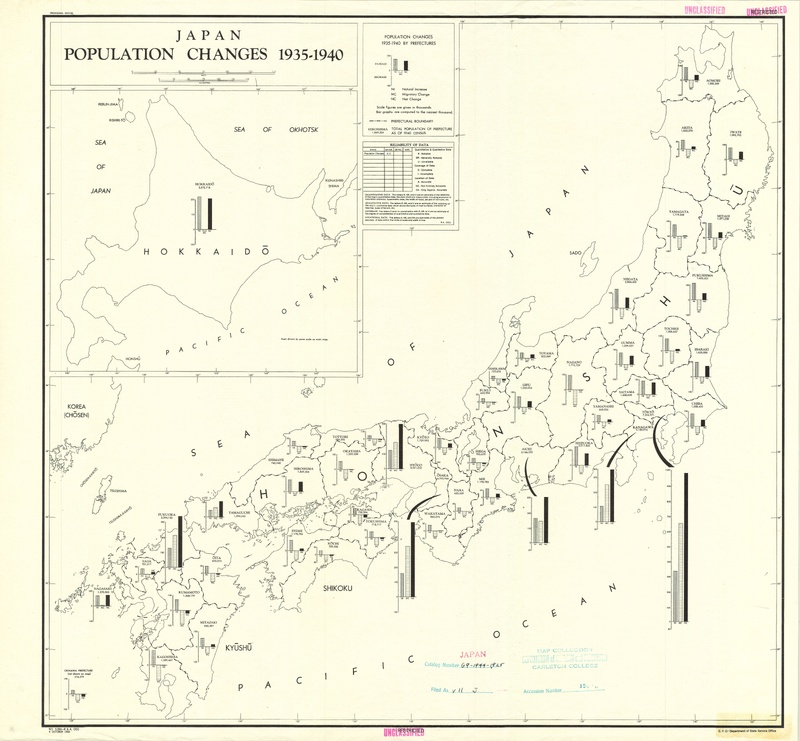 Japan Population Changes 1935-1940This map explains population changes across all prefectures in Japan from 1935 to 1940 by portraying a bar graph for each, showing natural increase, migratory change, and the resulting net change. Natural increase refers to population changes as the net result of births and deaths in the prefecture. Migratory change refers to population changes as a result of people migrating to and from the area. Finally, the resulting net change graphs the net changes in population taking into account both natural and migratory changes. The map delineates the Japanese prefectures, and each prefecture is labeled by name as well as with the total population of the prefecture as of the 1940 census. It includes the 4 main islands of Japan (Kyushu, Shikoku, Honshu, and Hokkaido), though Hokkaido appears as a scaled insert on the map and is not in its true location. There are also a few places on the maps that are labeled with their name but not population, such as Korea, Sado, and Tsushima. The map features the population change bar graph for Okinawa but does not include the island in the area covered. The reliability of the data is included under the key. According to the Department of State Services Office (G.P.O.), under the OSS Research and Analysis, the data has been deemed Reliable and Complete, as denoted by “R-C.” An overall trend in the data is migration out of rural prefectures and migration into urban prefectures. Though all prefectures experienced natural increase within the time period, most rural prefectures experienced a net decrease in population due to migratory change. In contrast, urban prefectures (Tokyo and Osaka, for example) experienced a large net increase in population.
 -
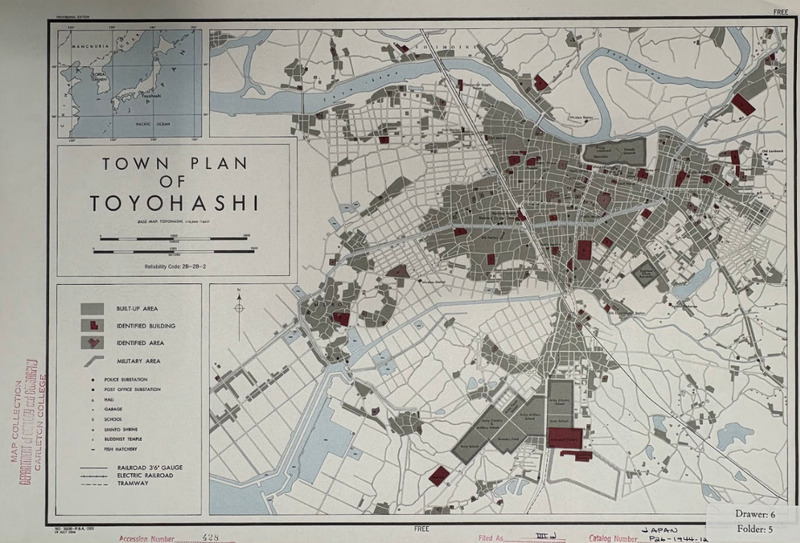 Town Plan of ToyohashiThe OSS Research and Analysis Branch produced this English US Intelligence map on July 19, 1944. This wartime map depicts a relatively large-scale, detailed urban plan of Toyohashi, a city located on the coast of Japan. Created at the end of World War II, the map was based on an existing Japanese map of Toyohashi from 1927, reflecting military intelligence efforts to document Japanese infrastructure. An inset map in the upper left corner shows Toyohashi’s location in relation to broader East Asia, placing this town in a greater geopolitical setting. In the map legend, a scale is provided which measures distances in both meters and yards. The layout emphasizes strategic urban features through clearly defined legends: built-up areas are shaded in gray, identified buildings and areas are marked in maroon, and military areas are marked with a dark gray border. In labeling facilities, as well as shading in the identified buildings and areas, the map maker makes an effort to highlight important economic, governmental, and community institutions including fish hatcheries, markets, government halls, schools, temples, and the local hospital. Transportation routes are identified separately in the legend as 3’6” gauge railroad, electric railroad, and tramway. Roads are also depicted, as well as bridges, and a ferry route over the Toyokawa River. Water is marked as light blue regions, and the rivers are portrayed in great detail, including the embankments along the Yagyu River at the bottom of the map.